Sunday, 19 November 2017

One small glued joint for a student, a great leap for the Blake Project!

The Blake Project progresses. With pictures!

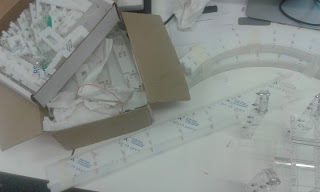
Work has been steadily progressing on the perspex track over the past month or so, but the past week has seen some major progress (not least because all lectures were suspended for a reading week). Because it was never going to be any other way, the first full completion of the track occurred this evening, just before the term resumes again. 

Shiny completed perspex track! (just imagine that the electrical tape holding the different sections together is not there)
 Why is this a 'first' completion?

  1. There is some trouble with the spacing between the rails at a couple of points. Unfortunately fixing this will probably require replacing the perspex of one of the straight sections.
  2. As seen in the photos the only satisfactory way to keep the track sections together at the moment is to use electrical tape - which is counterproductive in terms of making the race track look awesome. Ideally I would be able to glue all the sections together into one really large track piece. This might make the track difficult to handle and store so I will need to consult with the rest of the project team...
  3. Some of the pylons need to be moved around as they have been attached randomly at the moment with no thought for where the ones with extra attachment points should be so that the speed traps can use them.
These issues have to be addressed soonish, we have been asked to complete the project for 6th December by our supervisors, and many of the other project elements are now waiting on the track to be finished before they can start proper testing.

Therefore there is almost certainly going to be a 'victory' post in the near future! 

Until then ...

Atmosphere shot, same as when only the first two sections were complete, but now with the whole track!!

Hmm, I was going for more atmosphere - being able to see the top track from below - but all I can see is the mess of loose wires!

Thursday, 16 November 2017

When your problem is life ... and that infinitely repeating operation you programmed months ago

All right all right, I am the first to admit that in the grand scheme of things my programming ability is only slightly higher than that of a large twig.

However, my programs, in particular the growing gargantuan that is the Blake Project wireless network base station and autonomous car coordinator, do get to do some cool stuff.

The coolest of these is using my computer's full capacity. There is a certain joy in writing a program that takes so long to run that you can have a cup of tea while it executes ... if you ignore the fact that it is only relatively recently that this has stopped being a common occurrence, and that most of the delay is due to your inefficiency anyway. The Blake Project base station is a prime example of this pride's initial warm glow swiftly followed by agonising pain of n-degree noob programming burns.

In order to service both a GUI and several external serial links the base station implements multi-threading, executing multiple scripts 'at once' (not really it just fills in all the empty space that usually fills up a single thread of execution). While it means I get to use fancy terms like 'concurrent processing' when describing system behaviour, all this filling of idle operations also means that the CPU utilisation can get fairly high as well.

Unfortunately it got slightly too high as seen below, and the program started to lag.
Multithreading in python is only able to use a single processor core. We can see it maxing out the leftmost core until I swiftly kill it.
The primary reason for this was that one of the older threads had been allowed to request access to shared resources a quickly as it liked. This is BAD news, because it can ask as often as it wants (or can - if we have to insist that computers are inanimate), not getting the resource shortens the time the thread does other stuff for before asking again because what it was going to to do relies on the resource being given to it. Think annoying 'are we there yet' questions which are incessant until the answer is 'yes'.

The spoilt child analogy naturally develops when the thread's response to actually getting the resource is to look at it, see that nothing has changed since last time it looked (the data it was looking for only came through every now and then), and thus immediatly close the resource and release it for others to use.

Only to immediately ask for it back.

The solution is to teach everyone some manners, introducing delays into the loops of which the loops are a part, and re-enabling 'blocking' of the requests (pausing the program until it is successful, which reduces the number of requests enormously - there were good reasons for me disabling this I promise). This is going to have knock on effects later on which may or may not be irrecoverable, luckily that is for future me to work out.

Threads with manners, now using the CPU cores in a much more respectable manner. I don't actually know which one it is running on!
In fact, there is a large chance that that is what my next post shall be about, we'll have to see!

Tuesday, 14 November 2017

An Update

Silence for months must be followed with an update post, it is a rule of nature.

At the beginning of the (academic) year I listed some of the projects that I am working on at the moment. Question: how are they going? Answer: ummmmmmmmmm - I'll get back to you.

Immediately.

Blake Project:

Turns out not spending eight hours a day on a project can really slow progress. The AI has been semi constructed, the algorithm has been written, and so has the car driving code. All that remains is to plug it all together (which is always the longest part anyway!).

The track, is in pieces. Not as many pieces as it was, but it is many hours from completion. Luckily we have a reading week at the moment with many hours in it, many fingers are being crossed.

Its all there! Just not together.

 Telescope:

The updates that need doing have been identified, I really need to install a focussing mechanism better than a loo roll and friction. Also, upgrading the optical tube frame to be more portable, yet sturdier, is definitely on the cards at some point.

The telescope has had some good outings recently, trying but failing to see Uranus, getting a peek at Mars and a good look at the Orion nebula. I was going to try and point it at Jupiter and Venus on Tuesday, but the only place I could see them was from the middle of a road (I live in a city and they were close to the horizon), which I did not think was appropriate. They were awesome enough with the naked eye!

Solar Flare Detector:

Designed, the project decided to change the receiver to an SDR (software defined radio) based one, plugging the antenna (after a couple of filters and amplifiers) into a microphone slot and using a computer to do all the hard work. As it should.

Of course given that the solar flare detector should be running fairly constantly we have elected to use a Raspberry Pi as our enslaved processor - which means I have to relearn linux.

Also it got a name the GRand Assembly for Versatile Ionosphere Tracking and Astronomy of the Sun or GrAVITAS, a ripe source of puns, a source of gravitas (can't help myself), and of course an oblique reference to Iain M Banks. It looks very good in email headers.
The engineer at work, all four monitors in use. More screens = more work being done right?

Rubik's Cube Solver:

Good progress, but nothing of note yet. At least nothing worthy of photographing!


Lunar Rover Mk2:


Wow - got assigned to other projects within the space society for the moment, which was rather unexpected. The sneaky plan of the committee is to shuffle members around between projects as work amounts change. Ideally this means that some point in the future there will be much posting about rovers, the ideas coming out of the rover team so far are really rather cool.

Random Shiny stuff:

It always happens.

Robot Wars.

So the university electronics society run an ant-weight (150g, 10cm cube size limit) competition twice a year, so I should have seen this coming. Because this is going to be the fifth time we have entered, my team is going to attempt to build a cluster-bot, fitting multiple independent robots within the restrictions. This is leading to all sorts of fun and games trying to reduce the mass of the individual components of the robots which is likely to be the tricky bit.

This one also has a name, The Rock and a Hard Plaice, more details to come soon.

Who needs scales when you have string, water and a measuring jug?

Friday, 20 October 2017

An act of frequency folly

Working through some software problems today ended in some rather funny solutions this morning (why do programming breakthroughs always seem to happen when everyone else is asleep??).

It just so happens that both the Rubik's Cube Solver and the Solar Flare Detector are going to require me to become a pro at manipulating PC soundcards, both for sending and receiving signals.

Sending signals is fine:

    1. Find a nice stable interface library, 
    2. Bash together some sample values,
    3. Send them off to generic 'write' function,
    4. Play sweet sweet music,
    5. Become single most hated person in the lab for constantly playing annoyingly pitched sine tones...
Receiving signals is proving slightly trickier, or rather analysing the received signals in the frequency domain is proving rather mind bending. To illustrate, some nice graphs:
An arbitrary signal received through my PC's microphone (in the time domain). Ignore both axis for the moment.
The reported amplitude spectrum of the above signal. The fact that is is clearly just a copy of the original signal put through an 'magnitude' function rang many alarm bells. Another bell ringer was the fact that is not symmetrical around the Nyquist frequency (~22 kHz), a necessary outcome of an FFT. We can read the bottom axis as frequency directly.
An example of what I was expecting to see, a nicely prepared amplitude spectra of two superimposed sinusoids with a large DC offset. We can use the bottom axis as frequency again. Note that it ends at about 22 kHz, the magics of digital sampling mean that anything above this frequency is simply a reflection of the spectra below that point - it is easier to not show it.
What appeared to be happening was that the Fast Fourier Transform (FFT) function I was using seemed to like synthesised, simple, waveforms - but not horrible real life ones.

At this point it is probably a good idea to give some indication of the software I am using, as it turned out my interpretation of it was the cause of most of my errors. In general when programming on a PC or large computer I like to use Python 3, and for this particular task I deployed the potent Numpy/Matlibplot library combo. Initially I was using PyAudio to interact with sound related hardware, but I quickly realised that the sounds it was producing were awfully messy and did not correspond to the carefully crafted sine waves I was trying to generate. After digging around and seeing some other people complaining on various forums I switched to the SoundDevice library which promised to be more stable. It was, and I quickly progressed from producing signals to trying to receive them.

That was when I started producing graphs like those above. I dug around, maybe my received data needed to be in another format ... maybe I needed to change the sampling frequencies ... e.c.t. (That last 'solution' turned out to be an incredibly bad idea, I can only guess that the software  and hardware supporting the soundcard and Python interface is optimised for specific sampling rates, because who would want to change that? :) )

Several hours of digital sampling theory, frequent code double checking and desperate internet searches ended when I realised that I had misunderstood some documentation and got my rows and columns mixed up when feeding data to the FFT function.

As quickly as I realised my problem all anger at my poor computer subsided, I had been asking it to compute the frequency content of thousands of individual samples (which gives the amplitude of said samples at DC/0 Hz) and then plot the results. Instead of plotting a bunch of data points at x = 0, Python had plotted each individual result like a column graph which (unsurprisingly) produced a copy of the original signal with all negative results flipped to be positive. The reason the synthesised waveform had not had this problem was because it was stored differently and so did not have its rows and columns confused.

Once I started using the data correctly my issues quickly resolved and I began producing graphs like the one below, cheering and waking up all my flatmates...
A nicer frequency amplitude spectrum of the signal incorrectly processed above. It has had its spectra cut off around 22 kHz in the same manner as the spectra of the synthesised signal. I am fairly sure that everyone in my terrace of houses knows I was able to produce this graph. 
Sorry that this has been a bit of a dry post, I have to take the opportunity to write when something happens that is both applicable, and has shiny images!

Anyway, until next time....

New academic year == new projects

Another year of Uni has now begun, with the promise of a number of awesome projects to work on. This is not to say that the current work is going to be dropped, the Blake project in particular is continuing with the deadline of being complete by June next year.

However, the excitement always lies with the shiny new projects with all of the potential and none of the pragmatism (yet):

Being on the committee for the university's space society has meant that I was hoping to be able to push some electronics into the normal roster of rocket and rover projects. This push has resulted in the Solar Flare Detector being adopted as a project for this year. Consisting of a VLF radio receiver the end product will be able to track the sudden ionospheric disturbances that usually accompany flares hitting the Earth. Before you go and talk about us heading towards a solar minimum at the moment, which we are, there are still flares to be detected - just slightly smaller and less frequent flares. This project is currently starting up and already providing interest in the society from a broader range of subject disciplines, beyond the usual Aerospace Engineers.

The society is also re-entering the UKSEDS lunar rover competition after our successes last year (we came second), hoping to build on our design which ended up being decidedly improvised towards the end. It is likely the electronics are going to get a major overhaul but this should not be too hard given we now have experience.

Finally (for the moment) being the third year of the degree part of the assessment this year involves a group project. The aim of this project will be to produce a machine capable of solving a Rubik's cube. There are several restrictions that are going to add cool (and not obvious) electronics - I am sure that these will turn up in a future post.

Ongoing projects include the brilliant Blake Project, now cruising to completion - some sneakery is going to allow the accelerometer problem to be sidestepped, again I am sure that this will be written about somewhere else. The track itself is also slowly being completed - the workshop restocked perspex for the new term, and I immediately helped myself and spent a happy couple of hours producing all the parts needed.

At an even slower pace is the telescope, dredged from the depths of the blog. While I have really enjoyed using it so far there have been certain areas that either need improving or have already been improved. The mount (both tripod and pivot) have both been replaced with far more capable, but sadly not quite as DIY-y, elements. My range of eyepieces has also increased beyond a single dodgy 7.5mm plossl. Using the new setup I can clearly see all four stars in Mizar/Alcor, some awesome detail on the moon, the rings of Saturn e.c.t. However there is still more to do, I would like to 3D print an eyepiece holder and at some point I am going to need to replace the current optical tube frame.

All good things to look forward to, an hopefully write about!

A Summary:

Ongoing Projects:
    1. Blake Project (at a slower speed during the academic year)
    2. Telescope (gradually improving portability and stability)
New Projects:
    1. Solar Flare Detector (cooler acronym incoming)
    2. Rubik's Cube Solver (for degree)
    3. Lunar Rover Mk. 2. 

Monday, 11 September 2017

When your problem is life ... and statistics

We have been having slight issues with some elements of the race track system, today I decided to have a look at some of our problems using Matlab.

The issue is that there is a lot of noise in our accelerometer readings on the car. This makes distance and speed estimation rather tricky as errors are quickly accumulated and there is no easy way to get rid of them. So far we are implementing speed traps to try and give us defined locations and speeds for the car regularly.

While this does work, the autonomous car still has a tendency to floor the accelerator or brake at very odd points. I had a suspicion that these problems were arising from random noise in the acceleration readings, and set out to use Matlab to simulate a bunch of trials with lots of noise to see what the effect of this noise was.

For the simulations a constant acceleration of 1ms-2 had noise (normally or gaussian distributed with variance of 1) added to it. These acceleration readings were fed in to a set of equations mirroring those that run in the autonomous car and the distance/velocity predictions were recorded after a second. The beauty of using a computer like this is that (provided you have enough time) running a single trial is as easy as running 1000. For those interested the actual result of this test should be a final speed of 1ms and a final distance of 0.5m.

The results, surprise, surprise  seem to follow normal distributions:
Normally distributed with a mean close to the correct value, but an enormous spread of results.

Final velocity predictions were no better, although the mean was rather close
There are several things to note with this small experiment.

Firstly the noise in the acceleration readings was chosen at random, I will need more information from team members before I can make this more accurate. The noise profile is still plausible, if it is noise affecting our results chances are that it follows a normal distribution and a change in our readings of ~1ms is not impossible, given that we are reading from an analog accelerometer connected by long wires passing though an electrically noisy environment (with the car motor and track contact brushes).

Secondly, gaussian noise (the noise modeled) averages out to nothing if you wait long enough. Given how distance and velocity are calculated, this averaging out should be passed on to them in this particular scenario. Thus these two distributions are the best possible we might expect from our car. Ever.

This is a problem as much of the car's decision making relies on it having a good idea of where it is and how fast it is going, getting both of these bits of information wrong would explain some of the weird behaviour we have been seeing.

This is not a deadly problem, my next task will be to test some more complicated scenarios including varied acceleration and then work out a convolution I can use on the readings to try and give a more consistent result.

Until then!

Thursday, 7 September 2017

The Secret is Shiny-ness

With the Blake project nearing its end, one of the few major things left to do (apart from finalising and doing a final debug on everything) is to improve the look of the final product. Onward to many pictures, and then a bit of explanation:


The cars, a few versions after the last posted about. Now a full MDF chassis (which is a good thing?), removable side facades and a frame to allow for the easy mounting of electronic components. They have a really low track clearance so look hilarious going around corners.
A section of the new double layer track, construction still in progress. The track will be built mostly from clear perspex to make it look futuristic. It also has several functional purposes, the stacking of the two rails means we can have two track paths of equal length without resorting to a figure of eight design, making races fair while also keeping down the workload for the radar algorithms. It also ensures that our speed traps are only able to detect a specific car (the one on their rail), reducing their workload too.

The base station GUI in its start up state. It allows us to quickly change some of the track functionality (like turning the radar on and off), while also displaying some few properties of the system, such as which transmitting nodes have recently transmitted, and therefore whether they may have crashed. The black box at the bottom the window displays a log a all communications sent and received as the program operates useful for when trying to explain how our wireless network handles information.

This final push is mainly to improve the outreach value of the project, with three main aims.

Firstly we want to make the job of our presenters easier. By splitting up the different elements of the system, making them obviously discrete, the presenter will be able to walk through different parts of the system, and able to tailor their focus to the interests of their audience. For example, by adding a GUI to the base station we can remove the need for a demonstrator to start discussing the depths of the Python code, unless this is what their audience wants.

Secondly the final product needs to appeal to onlookers or even casual passers by, to make them curious about the track and its race cars. By making the track look awesome, hopefully we can provoke questions like: 'how does that bit work??', which is exactly what any presenter wants to hear as it allows them to jump straight into explanations and questions without having to focus to much on attracting people to talk to in the first place.

Finally we want to make the track and associated devices appear finished as an unfinished product will struggle to establish credibility for onlookers. This will ensure that potential audiences take the track and cars seriously and thus able to understand the elements of electrical and electronic engineering being displayed, rather than simply viewing it as a cool gadget thrown together but with no obvious value.

Hopefully when we are done in X units of time the project will end with something that can be used to help outreach for electrical and electronic engineering. While getting everything working is vital for doing this, improving the look of the final product is also necessary to be successful.

Friday, 1 September 2017

Kicad Hierarchy Is Key!

 Kicad is great.


But sometimes...one sheet is just not plenty.

So to make your incredibly cool schematic more manageable, splitting portions of the system into blocks is vital! Below I have a quick tutorial for how to make a hierarchical sheet (took me a couple of google searches to figure out at first).

Here's the video (4 minutes):


(And if embedded doesn't work: video)

And a text tutorial:

1. Go to... Click create Hierarchical Sheet and draw a rectangle of appropriate size. The size of the rectangle can be changed by right clicking on the sheet symbol and selecting "Resize Sheet".
2. Right click on the newly created block and click Enter Sheet.
3. Now you can create a lovely schematic for one of your system's sub blocks.

Now you may ask, "Andrey, how do we link this schematic to the top schematic?".

Well, it's quite easy. Simply click "Create a Hierarchical Label", write the name of your I/O pin and connect it to the circuit. Right clicking and pressing "Leave Sheet" will get you back into the top-level schematic. There you can import the labels for the sub module's ports and move them to an appropriate location on the block's symbol.

With this approach, systems of arbitrary complexity can be designed with ease. It's quite easy to split the daunting task of a huge system into manageable blocks.

Oh and another trick. If you made a circuit on the top-level (or any other sheet) that you want to copy into a hierarchical sheet, the steps are outlined below:

1. Select the circuit of interest, right click and press copy selection.
2. In the target hierarchical sheet click paste and the original circuit will appear.
3. Original circuit can now be removed from the top-level schematic.

Hopefully this brief tutorial will help those of you starting to create designs with lot's of ICs, buses and passives.

--------------------------------------------------
Andrey Miroshnikov

Your local digital designer/systems engineer ;) (Not qualified yet...)
 --------------------------------------------------
EDIT: Turns out the sheet symbol can be re-sized, duh! Also I was told the power connections carry through the hierarchy and hence, hierarchical labels for "GND" and "VDD" for example, are unnecessary.

Wednesday, 23 August 2017

A New Project

Prepare.....for a spam of posts like no other

Prototyping on the road. At its finest.
GSM module, OLED display, custom keypad and a micro, can you guess what I am making?

In the next couple of posts I will provide several tutorials for the tools I used as well as how to use some of the components you see in the above photo.

Oh and don't worry, the final product won't use an Arduino :p
(I'm striving to learn lots of new stuff this project anyway)

PS: As of 23/08/2017, the project is still ongoing.

--------------------------------------------------
Andrey Miroshnikov

Your local digital designer/systems engineer ;)

Tuesday, 22 August 2017

Collision avoidance testing: Is the radar up to the mark?

So after testing the radar's capabilities, I concluded two things. Firstly, the radar is certainly capable for collision avoidance at high speeds. Secondly, It's a pain in the butt to program at first. So, how did I come up with my first conclusion you may ask?

Well the company that produces these radars ( TI ) have made a Graphical User Interface to make what the radar outputs look pretty. The GUI gives us a visual of the radar capabilities like the X-Y scatter plot, which can accurately represent the location and coordinates of an object in front of the radar. Here is a video of the radar location system in action with the GUI in the bottom left!


As you can see, the car appears as a green dot whizzing around in a circular motion on the GUI. At times the car can appear as a group of closely-knit points due to the many possible reflective surfaces on the car (bonnet, doors, boot etc...). The radar is keeping up relatively well with the car as both the GUI and the actual car seem synchronised. It may not be perfectly accurate, but the radar is designed for much larger scale object thus it's doing remarkably well.

So the radar is pretty good at detecting an object move around at high speeds. Now how about a more realistic scenario. A reckless street racer called Dominic Toretto is participating in illegal racing activities for the thrill, fame and most importantly cash. He is notorious for his modified Mini Cooper.


Yes, OK ... not quite a muscle car, but it has enough power for a British version of Mr Toretto to wreak havoc on the streets. But what would happen if he was to approach a corner at high speed and have a sudden lapse of concentration? What would happen if he was too slow to brake and there were pedestrians on the pavement opposite him? Well, I'm sure you can answer than but this is where the radar comes in. Now if we model the radar as a pedestrian and an LED as the brakes of the car, we can see how it responds to such a scenario. If the LED at the bottom of the screen lights up as we cross the finish line, then its a job well done. At this point in the project I hadn't developed a suitable braking system for the car, but that is soon to come!


This slow motion video is perfect for seeing the exact location the car would brake. The LED goes high just before the car crosses the finishing line. This is important because at high speeds, the braking distance is much larger and so the car needs to stop sooner or it will skid off and cause damage.

So, the goal of this blog was to give you a visual of how we are testing the radar and how we might implement it in a demo for a university open day. A more technical blog on how the code is working and how I'm going to integrate a braking system with the radar will come soon. The key message here is that dangerous driving or a sudden lapse in concentration on the wheel can lead to life changing injuries or even death. I'm hoping that this piece of technology will be the norm for cars in the future to prevent such tragedies.